Summarizing the Data in Marketing Research
The first step in summarizing the data is tabulation. Individual observations or data are placed in a suitable classification in which they occur and then counted.
Thus, we know the number of times or the frequency with which a particular data occurs. Such tabulation leads to a frequency distribution as illustrated in Table 1 below:
Frequency Distribution

The frequency distribution may involve a single variable as in Table 1 or it may involve two or more variables, which is known as cross-classification or cross-tabulation.
The frequency distribution presented per se may not yield any specific result or inference. What we want is a single, condensed representative figure which will help us to make useful inferences about the data and also provide a yardstick for comparing different sets of data.
Measures of average or central tendency provide one such yardstick. The three types of averages are the mode, median, and mean.

Mode
The mode is the central value or item that occurs most frequently. When the data is organized as frequency distribution, the mode is that category that has the maximum number of observations (in the 121 – 140 category in Table 1).
A shopkeeper ordering fresh stock of shoes for the season would make use of the mode to determine the size which is most frequently sold.
Read Also: How Communications Influence the Role of Promotion in Marketing
The advantage of the mode is that it is easy to compute, is not affected by extreme values in the frequency distribution, and is representative of the observations clustered at one particular value or class.
Median
The median is that item that lies exactly halfway between the lowest and highest values when the data is arranged in an ascending or descending order. It is not affected by the value of the observation, but by the number of observations.
Suppose you have the data on the monthly income of households in a particular area. The median value would give you that monthly income which divides the number of households into two equal parts.
Fifty percent of all households have a monthly income above the median value and fifty percent of households have a monthly income below the median income.
Mean
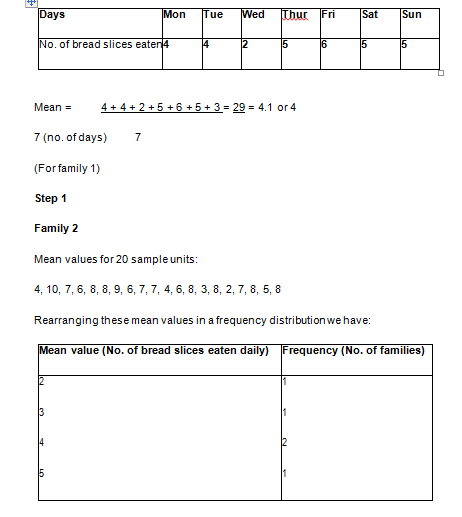
The mean is the common arithmetic average. It is computed by dividing the sum of the values of the observation by the number of items observed. For example, a firm wants to introduce a new packing of sliced bread aimed at the customer segment of small nuclear families of four members each.
It wishes to introduce the concept of a ‘single-day pack’, i.e. a pack which contains only that number of slices that are usually eaten in a single day. This strategy would help to keep the price of the pack well within the family’s limited budget.
The firm has many opinions on the ideal number of slices that the pack should contain – ranging from three to as high as twelve. The firm decides to hire a professional marketing agency to conduct market research and recommend the number of bread slices it should pack.
Read Also: How Advertising Works and Types of Advertising
The research agency goes about the task in two steps. In the first step, it randomly chooses five families (who are consumers of bread) in each of the four colonies in the city.
These families are asked to maintain for one week a record of the exact number of slices they consumed each day.
From this data, the agency calculates the average (or mean) number of bread slices eaten per family per day.
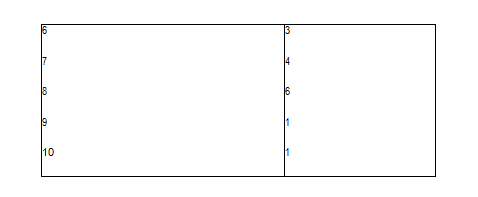
There would be twenty such mean values (5 families in 4 colonies each, sample size 20). In the second step, from these mean values, the model value would provide the answer to the number of bread slices to be packed in each pack.


The mode in this frequency distribution is 8. Eight slices are the most commonly occurring consumption pattern. The agency’s recommendation is to pack eight bread slices in the single-day pack.
The mean, mode, and median are measures of central tendency or average. They measure the most typical value around which most values in the distribution tend to converge.
However, there are always extreme values in each distribution. These extreme values indicate the spread of the dispersion of the distribution. To make a valid marketing decision, you need not only the measures of central tendency but also relevant measures of dispersion.
Read Also: Role of Advertising and Advertising Management
Measures of dispersion would tell you the number of values that are substantially different from the mean, median, or mode. If the number of observations at the extreme values is large enough to form a substantial number, it indicates an opportunity for market segmentation.
In the earlier example of bread, if in a larger sample, you find that the number of households who consume three slices per day is also substantially large, the firm may find it worthwhile to introduce a 3-slice pack for light bread consumers.
Such variations from the central tendency can be found by using measures of dispersion. The two commonly used measures of dispersion are the range and standard deviation.
Range
The range is the difference between the largest and smallest observed value. Using the data in step 1 in the bread illustration, the largest observed value is 6 and the smallest observed value is 2, therefore, the range is 4. The smaller the figure of the range, the more compact and homogeneous the distribution.
Variance and Standard Deviation
These two measures of dispersion are based on the deviations from the mean. The variance is the average of the squared deviations of the observed values from the mean of the distribution. Standard deviation is the square root of the variance.
The standard deviation is used to compare two samples that have the same mean. The distribution with the smaller standard deviation is more homogeneous.
Selecting Analytical Methods
Besides having a summary of the data, the marketing manager also would like information on interrelationships between variables and the qualitative aspects of the variables. This can be achieved through:
- Correlation
- Regression analysis
- Multiple regression analysis
- Others.
Report Presentation and Implementation
The final step is the preparation, presentation, and implementation of a report giving the major findings and recommendations. A typical format of the report may comprise the following sections:
- Objectives and methodology in which the research objectives are stated and details of the sampling plan are described.
- Summary of conclusions and recommendations in which the main findings of the research are highlighted. On the basis of the findings, some recommendations may be made.
- Sample and its characteristics which contain descriptions of the sampling units in terms of their geographical location, socio-economic profile, and other relevant details.
- Detailed findings and observations in which the data was collected are presented in a form that is easily comprehensible to the user. The data may be presented in tabular form or graphically in a bar chart, pictogram or pie diagram; or a combination of all these.
Read Also: Role of Personal Selling Process in Marketing


